Methodology
We use various methods, including statistical modeling, machine learning, and deep learning to extract insights from our data.
Methodology
Last updated on 10 October 2023
Our product development heavily relies on satellite data, which plays a vital role in identifying patterns and trends crucial for informed decision-making and identifying opportunities for improvement. We leverage historical data to establish long-term trends and patterns, while nowcasting provides real-time information about current conditions. Additionally, forecasting enables us to predict future trends, giving us valuable insights into upcoming opportunities and risks.
- For instance, we use satellite data to monitor changes in water extent, including surface area, perimeter, and volume.
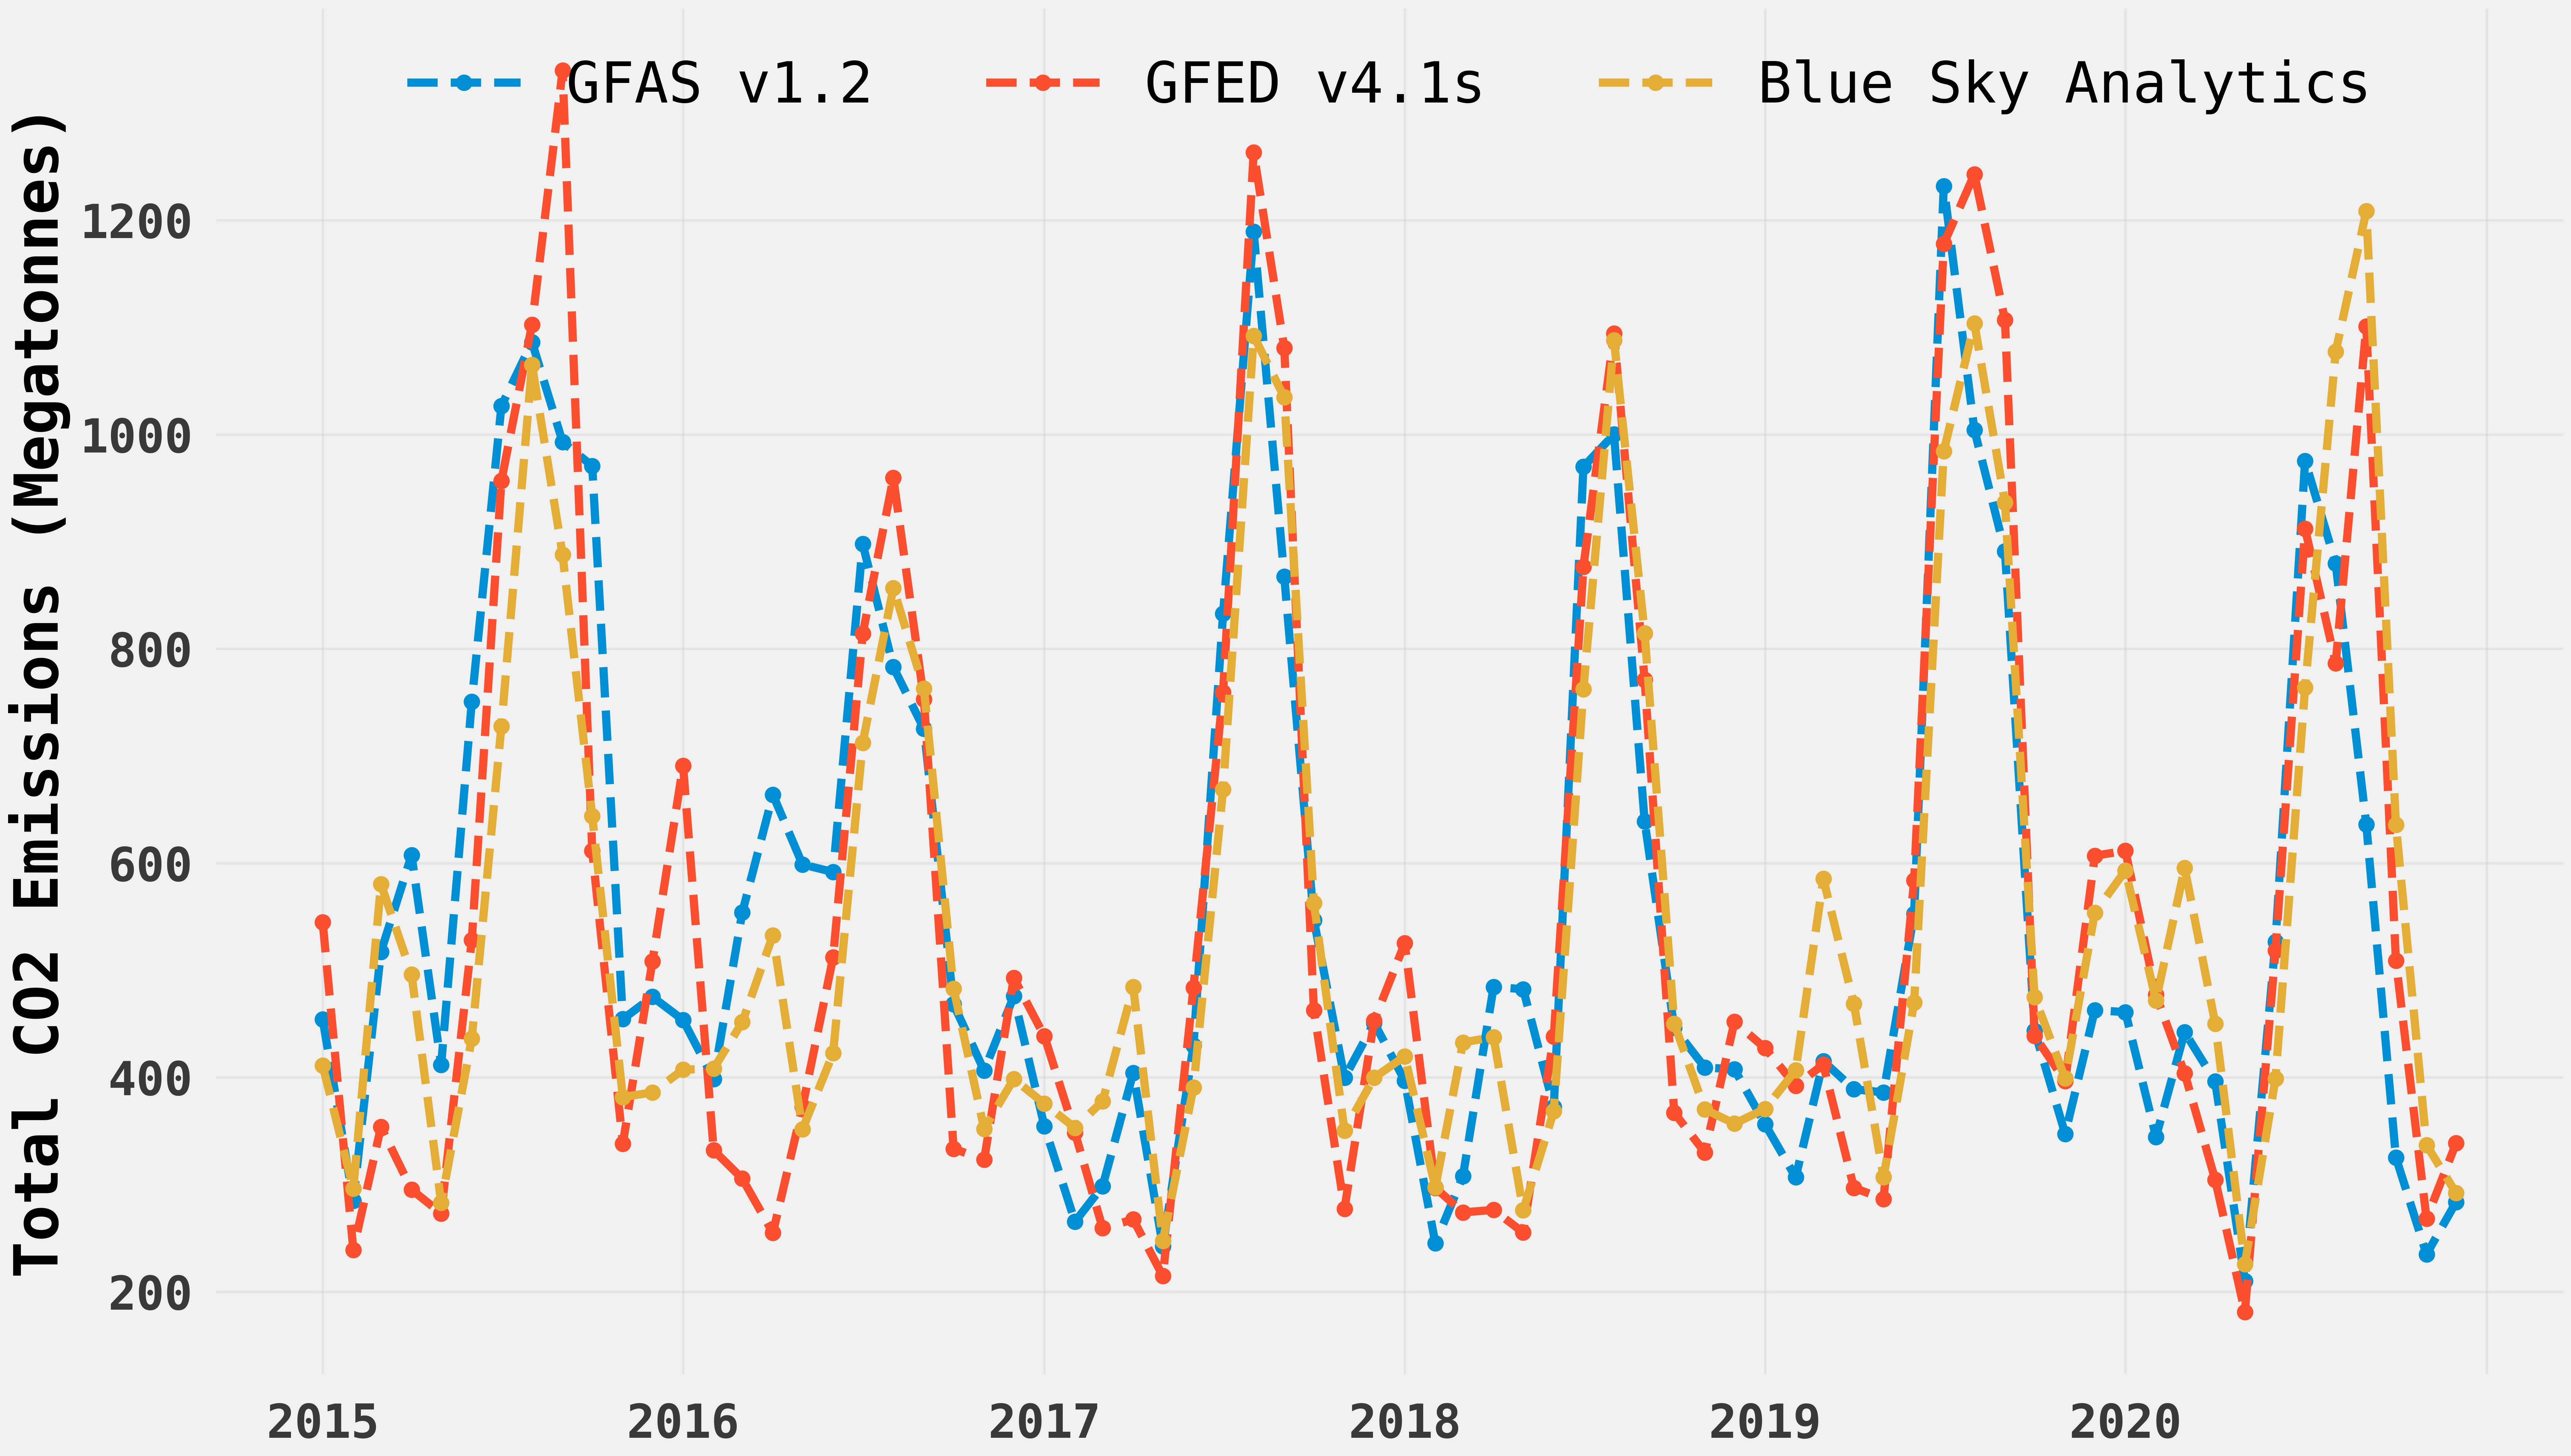
- We estimate fire emissions by analyzing satellite-derived fire radiative power (FRP), combustion coefficients, and emissions factors.
- Machine learning models trained on near real-time aerosol optical depth (AOD) measurements and meteorological data calculate PM 2.5 levels.
- We also estimate carbon dioxide emissions from power plants by training machine learning models on atmospheric gas concentrations, weather data, and plant-specific ground information.
- Moreover, we employ machine learning models to predict fire frequency hotspots that consider historical fire data, weather conditions, vegetation characteristics, and land use.
Data Sources
We collect data from various sources, including public and private satellite providers such as the European Space Agency (ESA), ECMWF, NASA, ground stations, and other publicly available datasets. Our team works with large volumes of data and handles complex data structures such as images, geospatial, and weather data. For instance, an image we analyze could have a resolution of 30 centimeters to 25 kilometers meters, and we analyze multiple images over time to understand changes.
How do we process the data using the cloud infrastructure?
Every day, we process 100 gigabytes of unprocessed satellite data and provide it to users in a compressed format that takes up less than 1 gigabyte of space. Processing 100 GBs of raw satellite data daily requires significant computational resources and storage capacity. Having a reliable and scalable system to handle such a large amount of data daily is also important.
The cloud infrastructure is a vital aspect of our organization, intended to handle the large quantities of data we process and analyze. The infrastructure comprises three crucial components: preprocessing, inference, and postprocessing. These components are deployed and powered by our trusted cloud services partner, AWS.
- Preprocessing
Preprocessing involves an ETL (Extract, Transform, Load) service responsible for aggregating and processing all raw data by applying a series of data preparation operations. These operations include data format standardization, quality checks, outlier filtering, and geospatial operations such as reprojection, merging, clipping, and geocoding. This service is critical as it converts all raw data into analysis-ready information ready to be consumed for analytics. This process ensures that the data is high quality, essential for accurate and reliable analysis. - Inference
The Inference component analyzes the preprocessed data and utilizes statistical methods, machine learning, and artificial intelligence to uncover crucial hidden information. The inference component can identify correlations between weather, aerosols, and vegetation and their impact on air quality. It can also forecast hotspots that are susceptible to fires in the next seven days using historical fires weather data and use deep learning and CNN to identify emissions from power plants by analyzing spectral reflectance from optical satellites like Landsat 8 and Sentinel 2. The Inference component enables better decision-making and action-taking to address environmental problems by converting raw data into valuable insights. - Postprocessing
The postprocessing component of our data infrastructure provides transparency on the accuracy of our predictions. It validates predictions generated by the inference component against ground truth data. In cases where ground truth data is unavailable, we use alternative data from similar research or published literature to benchmark our results. This ensures the reliability and accuracy of our predictions. It is a vital aspect of our infrastructure, providing a feedback loop to continually enhance our predictions' accuracy.
Our data infrastructure is designed to process and analyze vast amounts of data, producing high-quality information to tackle environmental problems. The preprocessing, inference, and postprocessing components are essential to our infrastructure, ensuring data quality, accurate analysis, and continual improvement of our predictions.
Why trust our insights?
- We continually evaluate and validate our models against new data sources to ensure they remain accurate and relevant. Our datasets constantly evolve, and we iterate with new techniques and sources as they become available.
- Our approach involves confirming the validity of our results and displaying the associated metrics on a monitoring dashboard to ensure transparency.
- We leverage the academic literature and domain experts to ensure our products are based on the latest research and best practices. We collaborate with experts in various fields to ensure our products are accurate, reliable, and useful.
- In the near future, we will release comprehensive research papers and white papers that delve into the intricacies of each of our distinct products. These documents will provide detailed insights and analysis to enhance our users' understanding of the underlying workings of our products.